فارسی
فارسی


A histogram, or image texture graph, is a chart that displays the frequency of pixels. In simple terms, every image has a certain number of pixels, and the grayscale value of each pixel can range from 0 to 255. The horizontal axis in the histogram represents the grayscale value or brightness level of pixels, while the vertical axis shows the number of pixels.
In this post, we will become familiar with the concept of image histograms and learn how to draw histograms in the best image processing and vision software. We will also explore how to use it as a valuable tool for image analysis, as understanding this analysis can lead to improving image quality.
To register for the “Machine Vision Training with Halcon Software” course, click here.
Drawing Image Histograms in HALCON Image Processing Software
To better understand and analyze image histograms, it is necessary to draw them first. Drawing histograms with the powerful HALCON image processing software requires only a few clicks, as explained in detail in the video at the bottom of the page. After drawing the histogram using image processing software, you can analyze your images based on the instructions provided in the rest of the article.
To download HALCON software (MVTec company), click here.
Read the MVTec Halcon software installation guide.
Drawing Histograms for Different Images
For a better understanding, consider the following examples:
The images below depict simple geometric grayscale shapes on white backgrounds. All images have very simple histograms. In these images, the grayscale part has a pixel value of 105. In all four images below, the area of the grayscale region (or regions) is the same. As seen in the images, the number of pixels with a grayscale value of 105 is 10,000 in all cases.
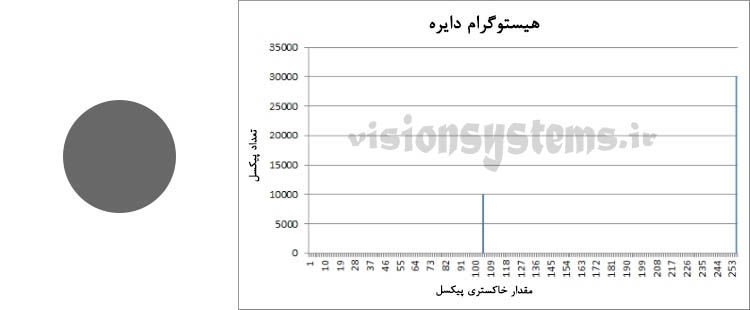
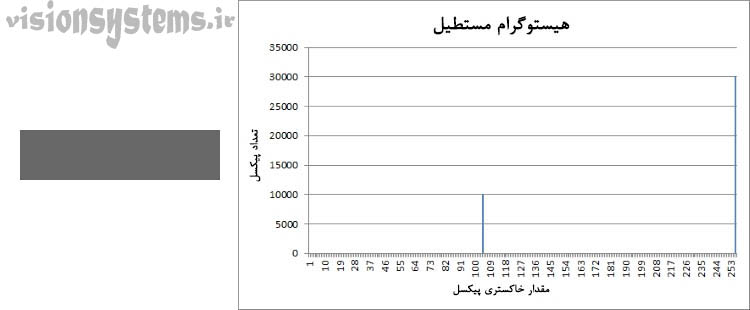
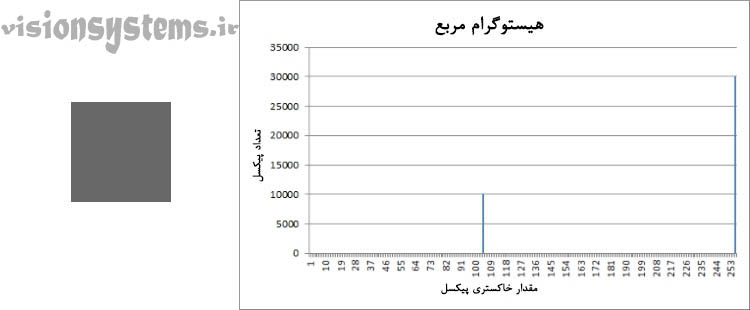
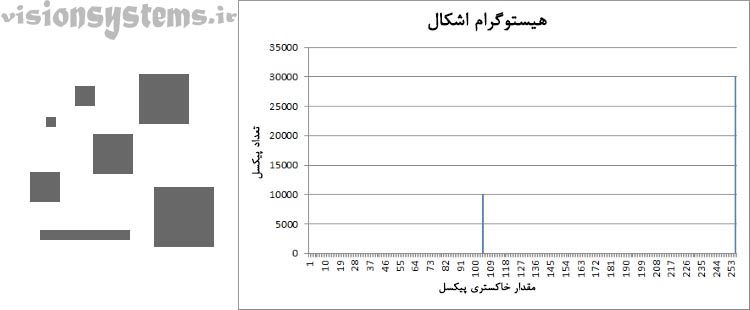
According to the image, the location of pixels in the histogram is not important. Therefore, these images have similar histograms. Note that histograms of images are generally much more complex than black and white images shown in the above examples. For example, the histogram of a black-and-white image is like the one below.
Relationship Between Image Histograms and Exposure
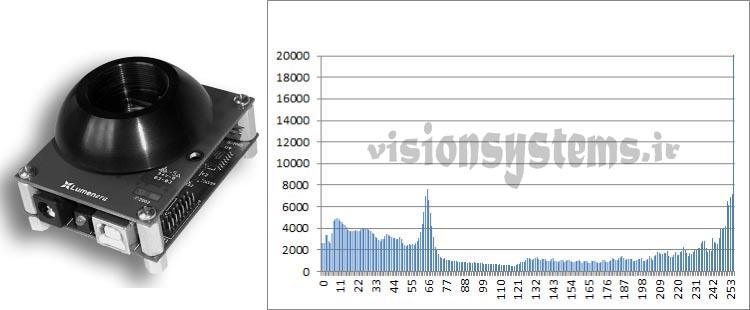
Now that we are familiar with the concept of histograms, we can analyze the histogram of an image based on its exposure. To illustrate the point, two images with different exposures are shown below. By carefully examining the images, we can learn to analyze the exposure of an image based on its histogram. Keep in mind that with this simple analysis, you can analyze and adjust the exposure of the image to improve its quality.
To analyze the exposure of an image based on the histogram, consider the image below. Note that due to the absence of dark colors in the image, the number of dark pixels in the histogram is very low and not visible. There are three possible states in the exposure of an image based on its histogram:
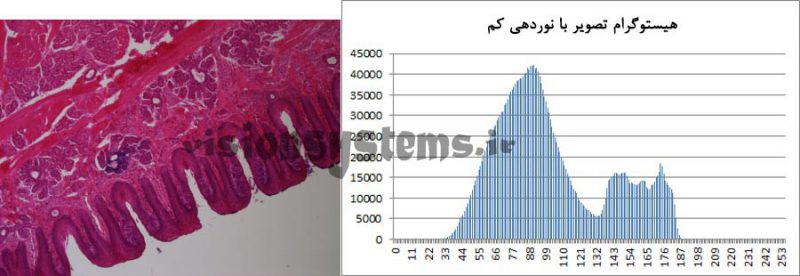
State 1: Underexposed Image Histogram
Consider the image below; this image is technically underexposed. As you can see, the brightest pixel in the image has a value of approximately 190. Increasing the exposure shifts the values to the right, creating brighter pixels.
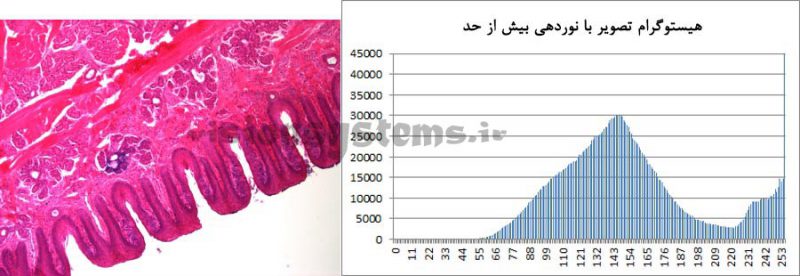
State 2: Overexposed Image Histogram
As shown in the image below, the number of pixels with a grayscale value of 255 is very high. This has created a tall spike in the histogram; this state is referred to as overexposure, meaning “excessive exposure.” In this case, pixels with a value of 255 in the image have saturated, and their number has increased significantly. The abundance of pixels with a value of 255 causes some of the image data to be lost.
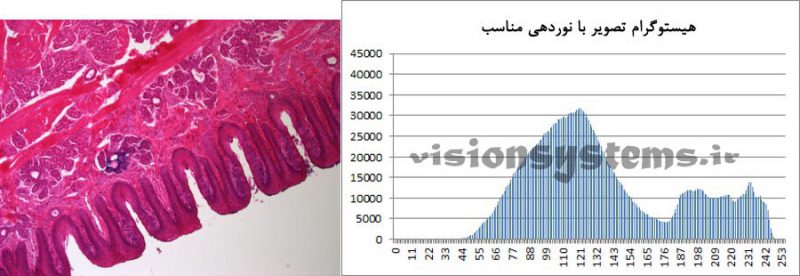
State 3: Properly Exposed Image Histogram
The image below shows an example of a histogram with proper exposure. As you can see, due to the scarcity of dark colors in the image, the number of dark pixels on the left side of the histogram is very low. On the right side, histogram values do not saturate, similar to the previous state.
Thus, with proper exposure, we can adjust camera settings based on the image histogram to optimize them; in other words, we adjust the image exposure time so that the histogram includes the entire range of grayscale values.
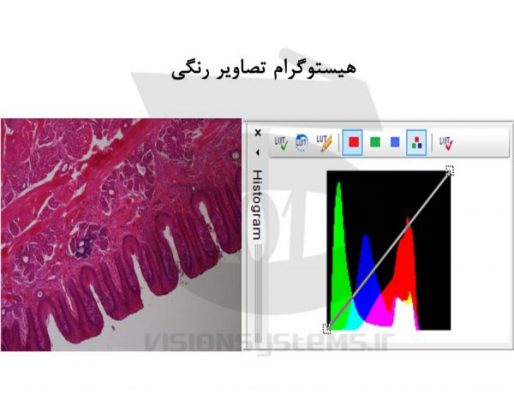
Three-Channel Histogram in Color Images
Images mentioned so far were black and white. As we know, each pixel in a color image has three values: red, green, and blue, known as RGB. In the image below, histograms are shown for grayscale RGB values with their corresponding colors. In Halcon software, histograms are easily displayed.
You can consult with our experts for your own projects.